Manpower program models
In the Army G-1, the team ran the Enlisted Grades model and combined it with the Officer Model to create the Active Army Military Manpower Program (AAMMP) each month. We used seven years of data for loss, retention, and personnel not available for assignment and time-series forecasting tools to assist in projecting the current strength forward for 5 years. Each month, I led a briefing to the Army G-1 called the Program Update Brief (PUB)
Human Resources command - Enlisted Grade / MOS Strength model simulation
Model built for Human Resources Command (HRC) in Summer/Fall 2004 in order to determine the Enlisted Distribution plan for a Brigade Combat Team (BCT) implementing a Lifecycle Managed Unit.
The initial problem that we had was the by grade model for a particular MOS in the BCT did not exist yet. Therefore, there was no way for us to compare (optimize) the distribution until we could model the behavior by MOS/Grade. At the time, there were over 400 different MOS/Grades in a Brigade Combat Team.
Part 1 of the solution to HRC’s problem. We need a model that given a distribution plan, determine the strength of each Grade and MOS by month so that we can compare different distributions of enlisted personnel over the course of 36 months. Collected 3 years worth of data for this model.
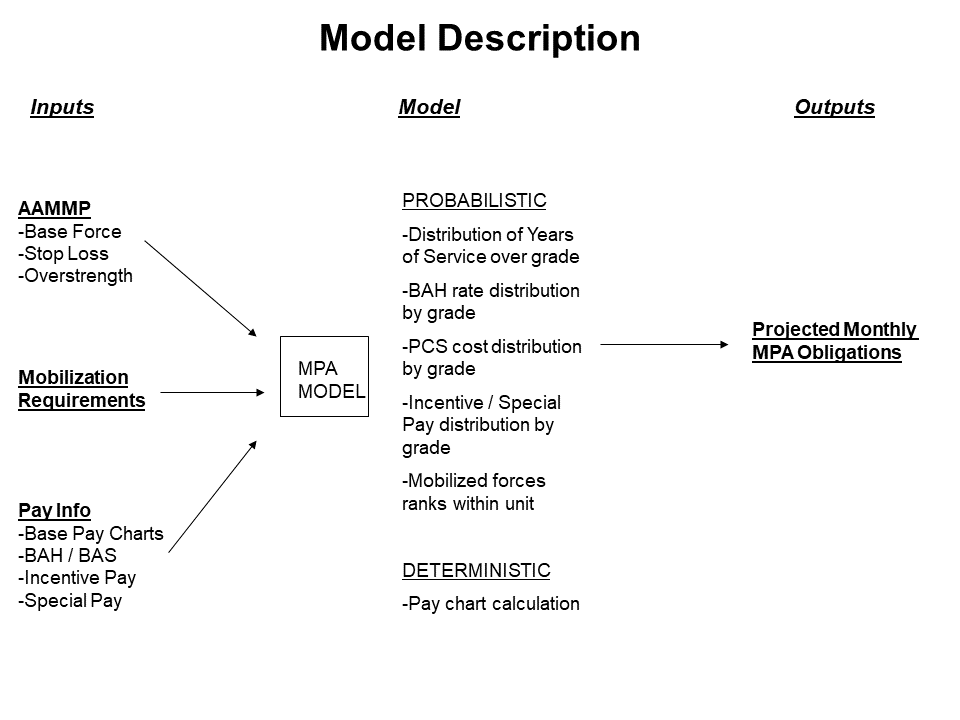
Military personnel army (MPA) obligations projection model
Model built for Army Deputy Chief of Staff for Personnel, G-1 in Fall 2005/Spring 2006. Upon arriving in the Army G-1 during the Fall of 2005, the Army was in the middle of mobilization, forced over-strengths, and stop-loss (preventing enlisted personnel to get out of their contract on the day that it ended due to the fact that they were in a combat zone). This new paradigm was causing the Army to not understand exactly why the MPA (personnel pay) account was being drastically over spent each month. As a result, I was sent to the Defense Finance and Accounting Services (DFAS) headquarters in Indianapolis in order to try to model the current pay system so that we could be better prepared to answer questions from Congress and the White House on personnel pay obligations in the future. An initial picture of the model is provided, but does not go into the required data sources in order to build this model.
This initial model provided a great deal of insight into the problem. The major cause to the over-execution of the MPA account was due to Directed Military Overstrength personnel who were growing in numbers and costing as much as 4x a normal soldier. This discovery allowed Army leadership to make decisions on their value to each organization.
Initial MPA Obligation model built to figure out pay discrepancies in the MPA account in 2005.
Model used in budgeting process and understanding how much projected strength would effect the MPA account.
Army Force Generation (ARFORGEN) Model - Dwell Time calculation
In spring of 2008, the Army Chief of Staff was announcing the building of additional Brigade Combat teams so that that Dwell Time for soldiers could be 2:1. This means that soldiers are home for 2 years (can be any time period), then deployed for 1 year. Unfortunately, the simple mental model does not work, so I built a model that could help visualize how these units were being used would effect units and soldiers at the individual level.
The Army leadership used this visualization to make decisions on force levels and manning documents.
Notional ARFORGEN with made up numbers, but to show the effect of the number of units, overlap of units in a deployment and required fill rates.
ARFORGEN Model and Dwell time effects and their relationship to the size of the force versus what size force we could be deployed.
Since the beginning of the war on terror, the Army leadership was focused on comparing loss rates with the previous year in order to make decisions on how to keep them comparable to history. When I was asked to make these comparisons, I provided a simple control chart so that the leadership understood that this was a stochastic process and that particular years numbers were well within the one standard deviations of the mean (with 11 years of history). As the year progressed, we were able to put our attention on the losses where the monthly values were greater than the 11 year history on a monthly basis for 7 consecutive months and recognizing that the probability of this occurring 7 times in a row was abnormal. This led to our ability to control end strength better than just focusing on recruitment.
Notional numbers with control chart data


